U.S. Department of Transportation
Federal Highway Administration
1200 New Jersey Avenue, SE
Washington, DC 20590
202-366-4000
The six agencies visited were in a state of transition– in terms of both their organization and their basic mission.
Three of the six agencies the scan team visited were in the process of reorganizing to merge the highway division with the state or regional transit agency. The mergers were driven by a central government desire to move from a traditional highway-centric approach to a broader, more inclusive strategy of surface transportation planning.
"We are moving people, we are serving business, and we are moving freight. We are no longer in the business of just moving cars," said a New South Wales official. "We are no longer in the business of counting cars. It is about allocating road space."
"We are a travel agency. That is what we are involved with. It is not just the road," said an SRA official. "We are community builders."
"The most important message was that we are the road authority, but we manage the transport network as one network that includes roads, buses, and trains. More and more, we are doing integration," said a VicRoads official in Melbourne. "From a road authority perspective, we can't build enough roads. If we did, it would not be a city anyone wants to live in. We need to manage the demand in travel."
The cause and effect of the agencies' performance management systems and their shift to holistic transportation agencies were not entirely clear. It appeared that the agencies' forecast of continuing degradation in travel time pushed them beyond strategies of only expanding highways. The agencies placed great emphasis on transit service, rail passenger service, land use integration, and moving people and freight as well as vehicles.
In Stockholm, Sydney, Brisbane, Melbourne, and Auckland, significant population growth and increases in traffic congestion were forecast to overwhelm the already-congested highway network. Sydney has a population of 4.4 million and is projected to grow by another 1.2 million. Melbourne is at 3.6 million, but officials believe the city will grow to 5 million by 2030. Brisbane is at 1.7 million today, but is expected to grow to as much as 2.9 million by 2026.
The agencies' refocus from just highways to a more diverse, integrated transportation network appeared to be driven by several factors. Public complaints about highway congestion combined with public reluctance for new highway capacity have driven some to emphasize transit options. The agencies' forecast on travel time reliability caused them to question whether they can add sufficient highway capacity to accommodate such growth. Concern about climate change appeared to be a much greater issue among the populace than in the United States. Finally, the cities in all of the countries appeared to have a greater willingness to influence land use development than is common in many U.S. regions. In metropolitan Sydney, the regional plan calls for 70 percent of the future growth to be in the central city area by infilling existing brownfields. Melbourne is emphasizing growth in five business districts across its region.
In Queensland, transportation executives said their major challenges are congestion, population growth, environmental sustainability, infrastructure development, and safety. In nearly all five categories, the challenges influenced them to support an integrated transportation system.
Through these comprehensive strategies, Queensland is looking to address growth, environmental goals, and congestion strategies through increased transportation system integration.
Victoria officials said the growth the region is experiencing is unmatched since the 1850s gold rush boom. Their long-range planning compels them to confront land use challenges as they plan how to sustain mobility across the network in the rapidly growing metropolitan region. They said it is difficult to overestimate the degree to which their plans call for integrating a rail, tram, bus, bicycling, and highway network into the development of the expanding region. To them, the integration of transportation and land use planning is an overriding consideration.
Closely related to the integrated transportation planning and delivery approach is the agencies' focus on environmental issues. All of the agencies visited had greenhouse gas emission reduction strategies as part of the performance measures focused on environmental concerns. Officials in all of the visited agencies said that climate change concerns were so important to the public that they were a driving factor in government policy, including transportation policy.
All of the agencies examined demonstrated a strong commitment to addressing climate change, even if they acknowledged they lack the strategies to achieve the ambitious long-term carbon-reduction goals their nations have established. Despite their nations' and agencies' strong commitment to addressing climate change, none of the agencies faced mandates to reduce miles or kilometers traveled. Their transportation-related climate change strategies relied on other tactics, such as improving vehicular fuel efficiency, reducing use of electricity in lighting and buildings, and encouraging nonautomobile passenger travel.
"Building a greener future means that low-carbon travel must be a genuine, viable, and attractive option for businesses and ordinary citizens," said the British secretary of state for transport in the Department for Transport's report, Low Carbon Transport: A Greener Future. "It does not mean government dictating which particular mode of travel people should use. Instead, what I want is to widen the options so that it is easier and a natural part of life for people— and businesses—to go for a low-carbon option."
The British government is a signatory to the Kyoto and European Union climate change agreements. It also has a national Climate Change Act. Collectively, those agreements resulted in a national goal to reduce carbon emissions by 80 percent from 1990 levels by 2050, with an intermediate goal of 34 percent by 2020.
The British government displayed a comprehensive set of strategies for reducing carbon emissions from transportation (figure 16). Its strategies fall into three areas:
Its strategies did not include targets for reducing kilometers traveled. Instead, it relied on a complete life-cycle approach to transportation carbon reduction that addresses fuels, vehicles, increased provision of transit and rail services, land use integration with transit, international cap-and-trade agreements for carbon, increased movement of freight by rail and water, and expanded research on transportation technology.
The British also promote "active travel," such as walking and cycling. Their reports indicate that in England, 60 percent of the population lives within a 15-minute bicycle ride of a railway station, but only 2 percent of the trips to stations are made by bike. They have announced a GBP5 million (USD8 million) program to install cycling storage facilities at rail stations nationwide.
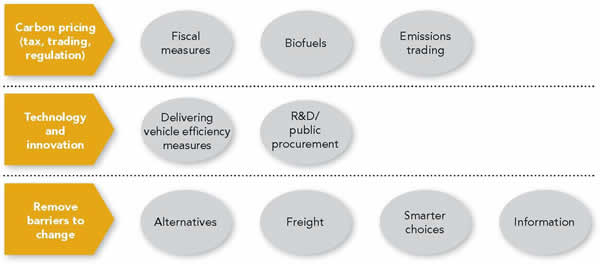
Figure 16. British officials are implementing strategies to meet their carbon targets.
"If we get this right," their major report said of their carbon approach, "by 2050 we can expect to see a fundamentally different transport system in this country. Road and rail transport will be largely decarbonized. The technical challenges are greater for aviation and shipping, but these modes too will have seen a transformative improvement in efficiency."
The British carbon-reduction performance goals for transportation rely heavily on decreasing emissions from the fleet, including cars, vans, large trucks, buses, trains, ships, and aircraft. For cars, the British have agreed to an EU strategy to produce significantly cleaner vehicles. The Department for Transport has funded a demonstration project for electric cars and, through the Technology Strategy Board, research and development funding is available to encourage further technical innovation in cars. The British also are supporting and testing cleaner vans. They are still exploring incentives for trucking, including examining regulation, investment, and best practices. They are incentivizing bus contractors to invest in cleaner vehicles. They are examining ambitious rail electrification and exploring further high-speed rail lines. They said the technological challenges for aviation and shipping are more difficult, but they support increased regulation and research to address those sectors.Both England and Sweden promote "eco-driving," which involves training drivers to slow their rate of acceleration and stopping to increase vehicle efficiency. The Safe and Fuel Efficient Driving program includes eco-driving training for van and large truck drivers. The government has invested GBP17 million (USD28 million) in promoting intermodal facilities to increase a shift from truck to rail or water shipping. It also has pledged to work with the freight industry to develop a common method for estimating carbon emissions from various types of freight operations. This accounting will be a first step toward a standardized estimation of carbon reduction from freight strategies.
Of the nation's 34 percent carbon reduction goal between 2008 and 2020, the transportation sector has a goal to contribute a 14 percent reduction in carbon emissions. The various strategies the Department for Transport has proposed would enable it to achieve its 2020 goal, largely through the use of cleaner vehicles and fuels across all modes, but primarily in the automotive, van, bus, and truck sectors. Achieving the goals beyond 2020 appears more difficult and less certain, officials said. Those larger reductions cannot be achieved with available technology. Unless significantly different technology comes into the market, additional reductions will have to come from reductions in automotive travel, something that is more challenging to accomplish and that has a potentially higher economic cost. They noted that the Department for Transport has responsibility over only 20 percent of the vehicle-kilometers traveled, while the remaining network is managed by local and regional governments.
"Providing choices is better than forcing people to change…. You can only go where your people are willing to be led," said one HA official.
The agency has produced a carbon-tracking tool so it can measure reduction strategies consistently. The Microsoft® Excel-based tool estimates carbon production from five main areas of HA transport operations:
The categories of carbon use are estimated for internal operations, highway operations, major construction projects, contractors who manage regional maintenance, privatized construction contracts, and tolling stations. The tool estimated that HA's carbon footprint for 2008–2009 was about 550,000 tons.
HA is exploring many strategies to reduce the agency's carbon footprint. It is conducting research on turning off highway lighting after midnight, a trial program that has saved 400 tons of carbon, but has not appeared to increase crashes. It is seeking renewable energy sources for its operations, increasing the use of recycled materials, and trying to emphasize lean construction strategies to use less energy during construction. Traffic operational strategies are a major component of its approach to reducing its carbon footprint as well.
The Victoria Department of Transport and VicRoads have long relied on triple bottom line performance measurement reporting to fully capture their effects on the environment. Triple bottom line reporting involves reporting performance on social, economic, and environmental factors in addition to business operations factors.
For many years, VicRoads has reported on environmental measures, such as the number of environmental citations it has received for violations on construction projects or maintenance activities. It has tracked a measure to reduce the amount of potable water used on construction sites and it measures a host of impacts from daily operations. Both it and the Department of Transport measure office energy use, paper generation, water use, fleet mileage, and overall waste generation.
Despite Victoria's impressive multimodal transportation system with its massive investment in trams, trains, and buses, its primary driver for those investments has been congestion relief and overall quality of life in the city. Those measures have not been linked to a specific greenhouse gas emission reduction goal. The state government has a long-term goal of reducing greenhouse gas emissions by 60 percent between 2000 and 2050. That goal, however, does not include a specific target for transport emissions.
"There is no simple, single solution to reducing transport emissions," said the government's policy paper on climate change. "This conclusion is echoed by a wide range of studies from Australia to overseas, which indicate that there are three broad options for reducing emissions from the transport sector:"
The state government noted that the massive investment it is making in the Victorian Transport Plan is its best effort to address transport emissions.
Sustainability Measures SRA officials said that environmental sustainability is a priority issue in their nation and that their transportation performance measurement system has embraced the reporting of environmental measures as another way to demonstrate the agency's responsiveness to public concerns.
SRA reports performance metrics for greenhouse gas emissions, other emissions such as hydrocarbons and nitrous oxides, the number of persons exposed to excessive highway noise, and the impacts of highway runoff in water catchment areas. SRA officials said that with their environmentally conscious population, environmental issues are very important, on par with economic concerns.
SRA reported that to reduce greenhouse gas emissions, it has adopted strategies promoting eco-driving, urging people to buy more efficient vehicles, promoting the use of transit, and reducing speed limits on many sections of road to reduce emissions and improve safety. It estimated that eco-driving has reduced carbon emissions by 29,000 tons, the campaign to influence motorist choice by 21,000 tons, speed limit changes by 6,000 tons, lighting changes by 4,000 tons, and various other measures by 6,000 tons (table 3). In all, it estimated its efforts reduced carbon emissions by 72,000 tons in 2008.
A related finding from the agencies was that they appeared to work more frequently with other cabinet agencies on cross-cutting issues, such as economic development, public health, and climate change. In part, this appeared to be the result of multiple agencies sharing responsibility for crosscutting policy goals.
In Sweden, the strong SRA focus on environmental sustainability, reduction in greenhouse emissions, and gender equality is influenced by a cabinet form of government in which government decisions are formed by consensus among all cabinet ministers. As a result, the concerns of the Ministry of the Environment and Ministry for Enterprise have significant influence on SRA policies.
The British Department for Transport shares responsibility for climate change with the Department of Health; Department for Children, Schools, and Families; and Department of Energy and Climate Change. The Public Service Agreements in Great Britain specify a lead agency, but also specify supporting agencies that are required to coordinate their efforts to achieve the goals.
In New South Wales, RTA is clustered in the state cabinet in the Employment and Economic Development portfolio, which includes the agencies of Planning, Transport, and Industry and Investment. In its State Plan, responsibility for cross-cutting issues such as environmental sustainability and economic development is parsed among different cabinet agencies, which are expected to cooperate on joint initiatives.
The performance management systems in the visited agencies were attuned particularly to focus on highway safety. The agencies not only had safety as a primary strategic goal, but their performance management systems included detailed reporting of strategies to reduce crashes. All of the agencies had crash rates noticeably lower than those in the United States (figure 17).
| Swedish Transport Carbon Emission Trends (Millions of tons) | |||||||||||
|---|---|---|---|---|---|---|---|---|---|---|---|
| 1990 | 1995 | 2000 | 2001 | 2002 | 2003 | 2005 | 2004 | 2006 | 2007 | 2008 | |
| CO2 Tons | 17.2 | 17.0 | 18.0 | 18.2 | 18.3 | 19.1 | 19.4 | 19.7 | 19.6 | 19.8 | 19.4 |
| Cars % | 72 | 71 | 69 | 69 | 70 | 67 | 66 | 65 | 64 | 64 | 63 |
| Trucks % | 18 | 19 | 20 | 20 | 19 | 21 | 22 | 22 | 22 | 22 | 23 |
| Buses % | 4 | 4 | 4 | 3 | 3 | 3 | 3 | 3 | 3 | 3 | 3 |
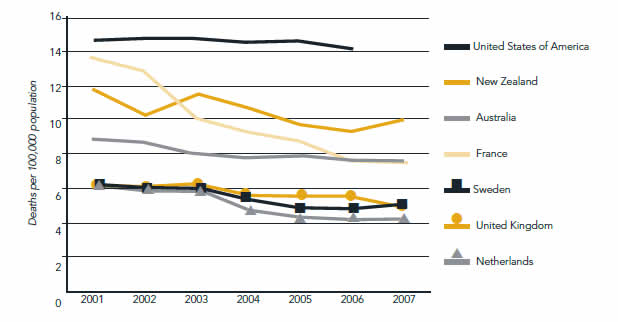
Figure 17. All of the agencies examined had fatality rates significantly below the U.S. average.
The Swedish and Australian agencies, in particular, achieved significant safety reductions by applying performance management tactics to reduce the number of crashes. They targeted not only black spot, or high-crash, locations, but they also applied programmatic treatments such as extensive cable barriers and skid-resistant pavements. In addition, they rely heavily on increased police surveillance, automated speed enforcement, and random alcohol breath tests to reduce speed and crashes.
Sweden's rate of highway traffic fatalities per 100,000 persons is less than half the U.S. rate. Despite starting from a relatively low number of crashes, the Swedish safety performance management system continues to achieve reductions in both fatal and injury crashes on its highway network. Fatalities fell from more than 500 in the early 1990s to 397 in 2008, the lowest number since 1945. Sweden has used a multifaceted and holistic approach to crash reduction that includes the following efforts:
The New South Wales RTA created a Centre for Road Safety to focus on vehicle improvements, behavioral changes, safer roadways, and technology improvements. The center is developing a business plan with specific goals and targets in each area.
The safety approach displayed in New South Wales was quite impressive, with an analytic and granular series of countermeasures and targets intended to address different types of crashes. The strategies include not only reducing crash risks on highways, but also making highways more forgiving so that when a crash does occur the roadway features limit the forces and energy to which motorists are exposed. The center reported that the most important behavioral factor it will focus on is speeding. It reported that up to 45 percent of all road deaths are attributable to excessive speed.
The center and RTA will address speeding the following ways:
The center is developing a series of key performance indicators for safety. Existing ones include fatalities per 100,000 population, fatalities per 100 million km traveled, and the number of fatalities involving young drivers.
It also is developing indicators to measure the effect of behavioral strategies, such as the reduction in the number of fatalities in which speed was a factor, the percentage of heavy vehicles exceeding the speed limit, and fatalities in which seatbelts were not used. For outputs, it will measure the number of miles of highways on which speed cameras have been installed, the percentage of high speed-prone areas identified for enforcement, and the number of reduced-speed limits instituted in high-pedestrian areas.
RTA and the Road Safety Centre broke down high-crash, or black spot, areas into great detail. In the process, they learned that roadway departure crashes were most common on curves where the radius was sufficiently tight to cause handling maneuvering difficulty, but not tight enough to cause drivers to slow down appreciably. Tighter curves caused drivers to slow down sufficiently to avoid roadway departures, while larger radii curves could safely accommodate the roadway speed. By honing in on curves with these specific problem radii, they targeted limited safety funds and effectively reduced roadway departure crashes. NZTA pursued similar radii analysis to identify crash-prone curves for additional treatment.
VicRoads in Victoria, Australia, has been cited frequently for its significant improvement in highway safety in the past decade. The scan team found continued emphasis on the state's safety performance management system during the 2009 scan as well. The government has a goal of a another 30 percent reduction in highway fatalities by 2017.
The Victoria government became aggressive in the early 2000s by implementing strategies such as installation of speed cameras, increased enforcement, stepped-up behavioral campaigns, and increased engineering treatments on highways. The current effort builds on earlier successes by deploying additional strategies and treatments based on an effectiveness analysis of the original safety programs. The agency worked with university researchers to model past successes so that the benefits of additional treatments could be forecast.
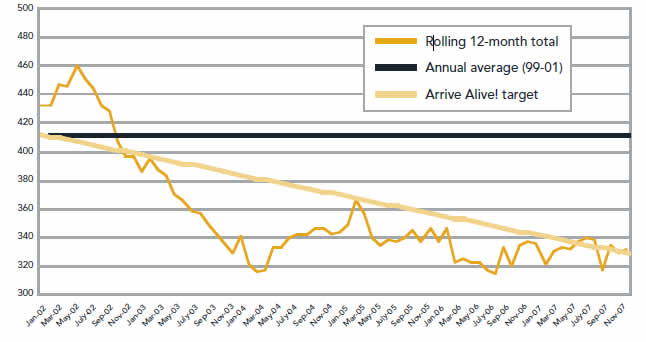
It began a 10-year Arrive Alive! strategy with 3-year action plans, with each component of the plan tracked to an individual manager to ensure accountability. The results are summarized and reported quarterly to the minister for transport (figure 18).
The agency also engaged the community to test the degree of public support for aggressive interventions and found substantial support for strategies such as stepped-up enforcement. The public support led to innovative funding programs, such as an additional fee when motorists buy car insurance. The proceeds are used to fund additional safety treatments. A levy of AUD84.70 was imposed on motorcycle registrations, and the proceeds are devoted to motorcycle safety improvement projects. A Victorian Motorcycle Advisory Council advises the minster on use of the funds, which have been prioritized for education and training, engineering and technology, enforcement, and enhanced data collection. To date, 51 motorcycle black spot projects have been completed, with a 38 percent crash reduction rate at those locations. Motorcycle fatalities in Victoria have fallen 20 percent since 2002, despite a 15 percent increase for the rest of Australia. Projects selected by the two funds have an average benefit-cost ratio of at least 3:1.
Another popular program is the "grey spot" program. It targets locations that have a propensity for crashes even if they have not had enough crashes to qualify for the black spot program. It has invested AUD31 million over 3 years on locations based on a crash risk calculation. Almost half of the spending has been to reduce run-off-the-road crashes, with the most common treatment being cable barriers.
Several agencies displayed a very progressive attitude toward highway operations, spurred by their efforts to meet reliability goals. The British, in particular, have invested considerable effort in measuring reliability on high-volume national routes. All of the agencies reported that their reliability measures were evolving and they were not entirely satisfied with their measurement tools. However, it was clear that the more urbanized agencies in the United Kingdom, Australia, and Sweden have invested considerable effort in measuring real-time highway, transit, and rail operations to improve travel time reliability, enhance transportation choices, and reduce greenhouse gas emissions.
In Great Britain, Department for Transport officials said they changed their entire approach to relieving congestion on major national routes when tight revenues and increasing public resistance to land takings prevented the widening of highways (figure 19). However, the nation's performance goals required improvement in travel reliability. As a result, the department adopted a "sweating-the-asset" approach to use advanced operations strategies to squeeze more capacity out of the existing freeway network.
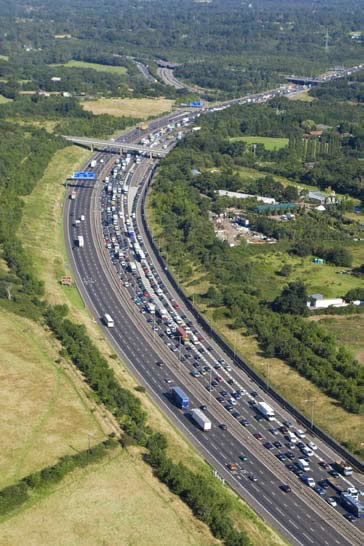
Figure 19. Traffic on Great Britain's M25 illustrates the
congestion challenges facing the nation.
British officials said that beginning in 2002 the agency changed its mindset from being a network builder to a network operator. The public demanded improvement in travel time reliability, but had little acceptance for projects that increased the footprint of existing motorways. The motorway system in England is only 2 percent of the total network, but it carries one-third of all traffic and two-thirds of all freight. Travel time data showed steady increases in congestion, and the agency's forecasts predicted that reliability would continue to suffer. The agency also was under pressure to reduce crashes. Its performance measures for crash reduction spurred action, as did the secondary benefit of preventing delay on the motorways when crashes occurred.
The first major change to bring about new capability as a network operator was the introduction of the Traffic Officer Service to assume responsibility for routine traffic management from the police on motorways. The U.K. Department for Transport had been downsizing for three decades, but it made an exception to that policy by hiring 1,500 traffic officers to assist with the program. The officers do not have enforcement powers, but they are equipped with uniforms, vehicles, flashing lights, and other tools to instruct motorists and assist them when they are involved in crashes. Traffic officers were operating across England by 2007. This program has offered more incremental benefits than new or widened roads, but it has tackled nonrecurrent delays, which are the most difficult for motorists to plan their journeys around, and has provided benefits much more immediately than traditional road-building solutions.
The second major change was the introduction of managed motorways, where the focus has been on opening the shoulders during congested periods (figure 20) and making a substantially more intensive use of intelligent transportation systems technology to manage traffic.
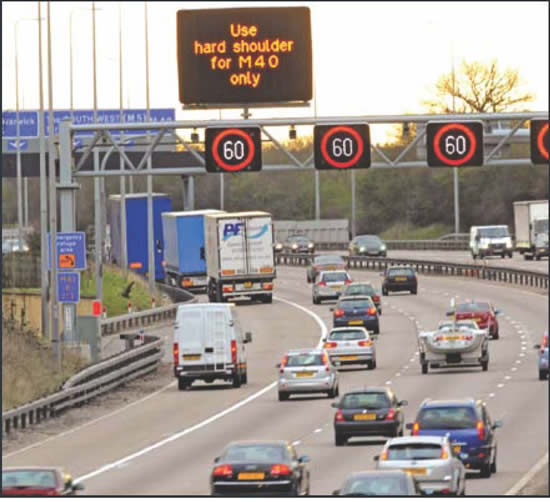
Figure 20. The use of shoulders during peak periods has become a common British congestion strategy.
An expensive, contentious highway-widening project would take years to plan, approve, design, and construct. Such projects "future proof" congestion, while operational strategies provide nearly immediate relief, officials said. The strategies work in the existing right-of-way and involve adding dynamic signage, closed-circuit cameras, response crews, and operational strategies to manage incidents. A key aspect of the British approach is the hard-shoulder running strategy, or the opening of shoulders as travel lanes in peak times or during incidents. The program was so successful that the department minister recently announced that HA would add 520 additional lane-miles, 340 of which are managed shoulders.
Division officials said the programmatic use of hard shoulders combined with real-time operations led to a profound shift in agency culture on managing motorways. Now, managing lanes is viewed as a core, ongoing business function that combines teams of multidisciplinary traffic engineers, information technicians, and on-the-road officers and maintenance crews to respond immediately to incidents. The program led to the development of a suite of strategies and skills, such as improved equipment for quick crash analysis. Emergency response trucks are dispatched to assist with crash scenes and set up temporary signage. Best practices and manuals are produced to teach responders how to manage scenes safely. Predetermined detour routes are planned for when serious incidents close lanes. Driver location signs were installed so motorists calling from the roadway can identify their location easily.
British officials said the program requires four elements:
British officials said the conventional wisdom at first was that closing the shoulders would decrease safety, but that has not been the case. Instead, the driving environment created by combining hard-shoulder use with traffic management technology has substantially improved safety. They constructed turnout areas along the routes and observed them by closed-circuit television to monitor if unsafe conditions occurred because disabled vehicles had trouble accessing the turnouts. They said the observation revealed few problems and indicated that most stopped motorists who used the turnouts did so for an emergency restroom break.
"What did we lose in use of the shoulder? The question is what were we gaining from these things in the first place or were they just a safety blanket?" the official asked.
British officials were effusive about the success of the program. The HA divisional director said it provided meaningful congestion relief, fewer crashes, and greater reliability for the motorway network in his region. He predicted that such operations strategies will be viewed as the natural transition to making better use of scarce motorway capacity.
The underlying performance measure that spurred HA's approach was the reliability performance measure the agency had negotiated with the Treasury in 2004. Several years of tracking the measure combined with the inability to afford and get approval for major widenings led to the operational strategy adoption.
The agency believes it is one of the few, if not the only agency, to actively track reliability performance on a daily basis across an entire national network. The agency identified a Strategic Road Network of 2,700 km (1,678 mi) of motorways and 4,350 km (2,703 mi) of other trunk routes. It divided those routes into 103 sections with 2,500 total links.
The HA Traffic Information System database holds the average journey time traffic flow of every link of that network for every 15-minute time period. The travel speed and reliability data come from several sources, including inductive loops, traffic plate cameras, and Global Positioning System (GPS) tracking systems. The data are compiled into ongoing travel speed data and compared to a 2004 baseline.
From the data, officials measure the amount of delay on the 10 percent most congested sections of the network. Reliability is measured as average vehicle delay on the slowest 10 percent of the journeys. The slowest 10 percent of journeys are selected for each 15-minute departure time between 6 a.m. and 8 p.m. for each day of the week on 95 of the 103 routes on the Strategic Road Network.
A dashboard is produced that illustrates rolling averages of travel time at locations across the network. Observation of the data over time led to a greater appreciation for the following:
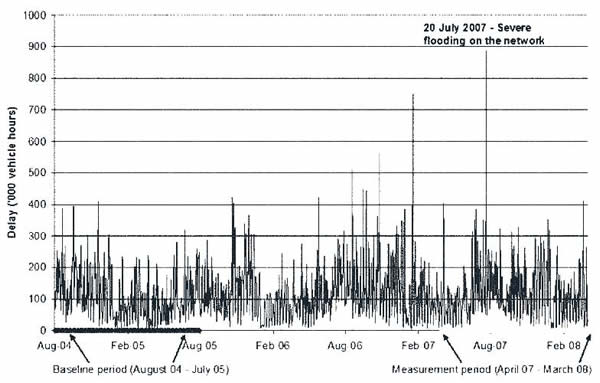
Figure 21. Great Britain's reliability indices allow the nation's transportation officials to track delay and how it is affected by events such as weather.
The analysis led to many types of interventions and significant increases in accountability. The focus of measurement in the 10 urban areas is "person journey times." Officials estimated that the total reliability measurement program and its associated interventions produced a 3:1 benefit-cost ratio.
British officials said their network reliability program has improved their understanding of system performance and led to increased evaluation of intervention strategies. But they acknowledged they are not completely satisfied with their program and want to improve it. They noted that measuring reliability is difficult because of shortcomings in data, definitions of what reliability is, and the lack of sensitivity to intervention strategies. The results of their interventions and measurement revealed that for a 10-mi (16-km) journey, a motorist undertaking one of the 10 percent slowest journeys would be subject to 3.4 minutes of delay, compared to 3.9 minutes before the interventions. Such metrics are difficult to explain to the public, they said. Such small differences in average travel time could be attributed partially to the economic downturn, which depressed overall travel. They are pleased that their system responded to the Treasury requirement that they uniformly measure and improve travel time on the major highway network. But they also acknowledged that explaining the results of the reliability measure to the public and decisionmakers is difficult, and this is the focus for improvement.
The Sydney region has been a world leader in highway management since it developed the Sydney Coordinated Adaptive Traffic System (SCATS) in the 1970s. The ever-evolving computerized control system links the region's traffic signals to optimize signal timing and traffic flow across the entire region. The RTA-developed software is widely used across Australia and has been exported to more than 130 cities in 30 countries. New South Wales officials said it is a very adaptive system that continually responds to changes in traffic.
A Public Transportation Information System tracks buses in real time and alerts the bus if it is more than 2 minutes late. It also can coordinate with SCATS to provide signal preemption to keep buses on schedule and moving efficiently.
The New South Wales RTA measures reliability by monitoring morning and evening average travel times on its seven most important urban routes. It has invested considerably in both operational and capital improvements to sustain travel times as the population grows.
In addition to making large investments in busways around Brisbane, the Queensland Department of Transport and Main Roads is combining various city and suburban traffic operations units into regional traffic management centers. The department will coordinate and manage all of the region's urban traffic signals with one system. It will coordinate the operations of the various local transit bus providers as well.
Similar to New South Wales, Queensland tracks travel reliability by measuring morning and evening travel speeds on a representative section of the urban network.
Victoria produces an annual report on the performance and management of its freeway and arterial network.It has monitored travel performance on its network since 1994. It reports travel speeds, travel volumes, tram speeds and reliability, journey trends by bicycling, and traffic volumes. The report feeds into its travel time reliability measures, which influence investment in projects and programs to improve reliability.
SRA produces a large and highly granular series of measures on accessibility to transportation, travel time, and travel reliability. It measures the travel times to major towns for rural residents and reports changes over time. Because of the large number of unpaved rural roads subject to seasonal weather damage, travel times to larger population centers for rural residents can change seasonally. The average travel time for rural residents and by area are tracked and reported as part of the agency's travel time reliability measure. In its 2008 summary, it reported degradation in overall rural travel times to population centers, with 813,000 people having improved travel times and 1,133,000 having lengthened travel times.
SRA tracks travel speeds on major routes in its three major cities, Stockholm, Malmo, and Goteberg. It reported in 2008 that travel speeds had generally increased in Stockholm and Goteberg and declined slightly in Malmo. It reported on the steps taken in each area to improve traffic flow and reliability and reported on planned improvement strategies for the next year.
| << Previous | Contents | Next >> |

